HOW WE CRACK DATA INTO CONTENT STRATEGY
#. Disclaimer: The information and images provided are only a partial representation of what can be disclosed. There are many other insights that must remain confidential due to company trade secrets.
Summary: Brief overview of the current situation
Total views across YouTube and TikTok in 2025 reached approximately ~18,179,691 from about ~72,000,000 impressions, representing a view rate of ~25.25%.
From TikTok: ~37m impressions resulted in a ~28% view rate.
From YouTube: Combined impressions for both short and long-form content were ~34m, resulting in a ~21% view rate.
Increased YouTube subscribers by ~20,000 people, growing from ~297,000 to ~317,205, which is an increase of ~6.3%.
The combined Engagement Rate for TikTok and YouTube is around 4.2%, which is considered within the standard range for audience interaction.
Engagement Rate on TikTok is approximately ~5.24%, which is quite good.
Engagement Rate on YouTube is approximately ~2.6%. This is normal, though long-form videos tend to have higher interaction rates from viewers.
The number of videos posted on YouTube decreased from 171 clips in 2024 to 117 clips, a reduction of about 32%. However, when using correlation and regression to predict performance, the efficiency of views per video actually increased by 46%. Average watch time increased from ~3 minutes to ~4 minutes, indicating that the content is more effective at retaining the audience.
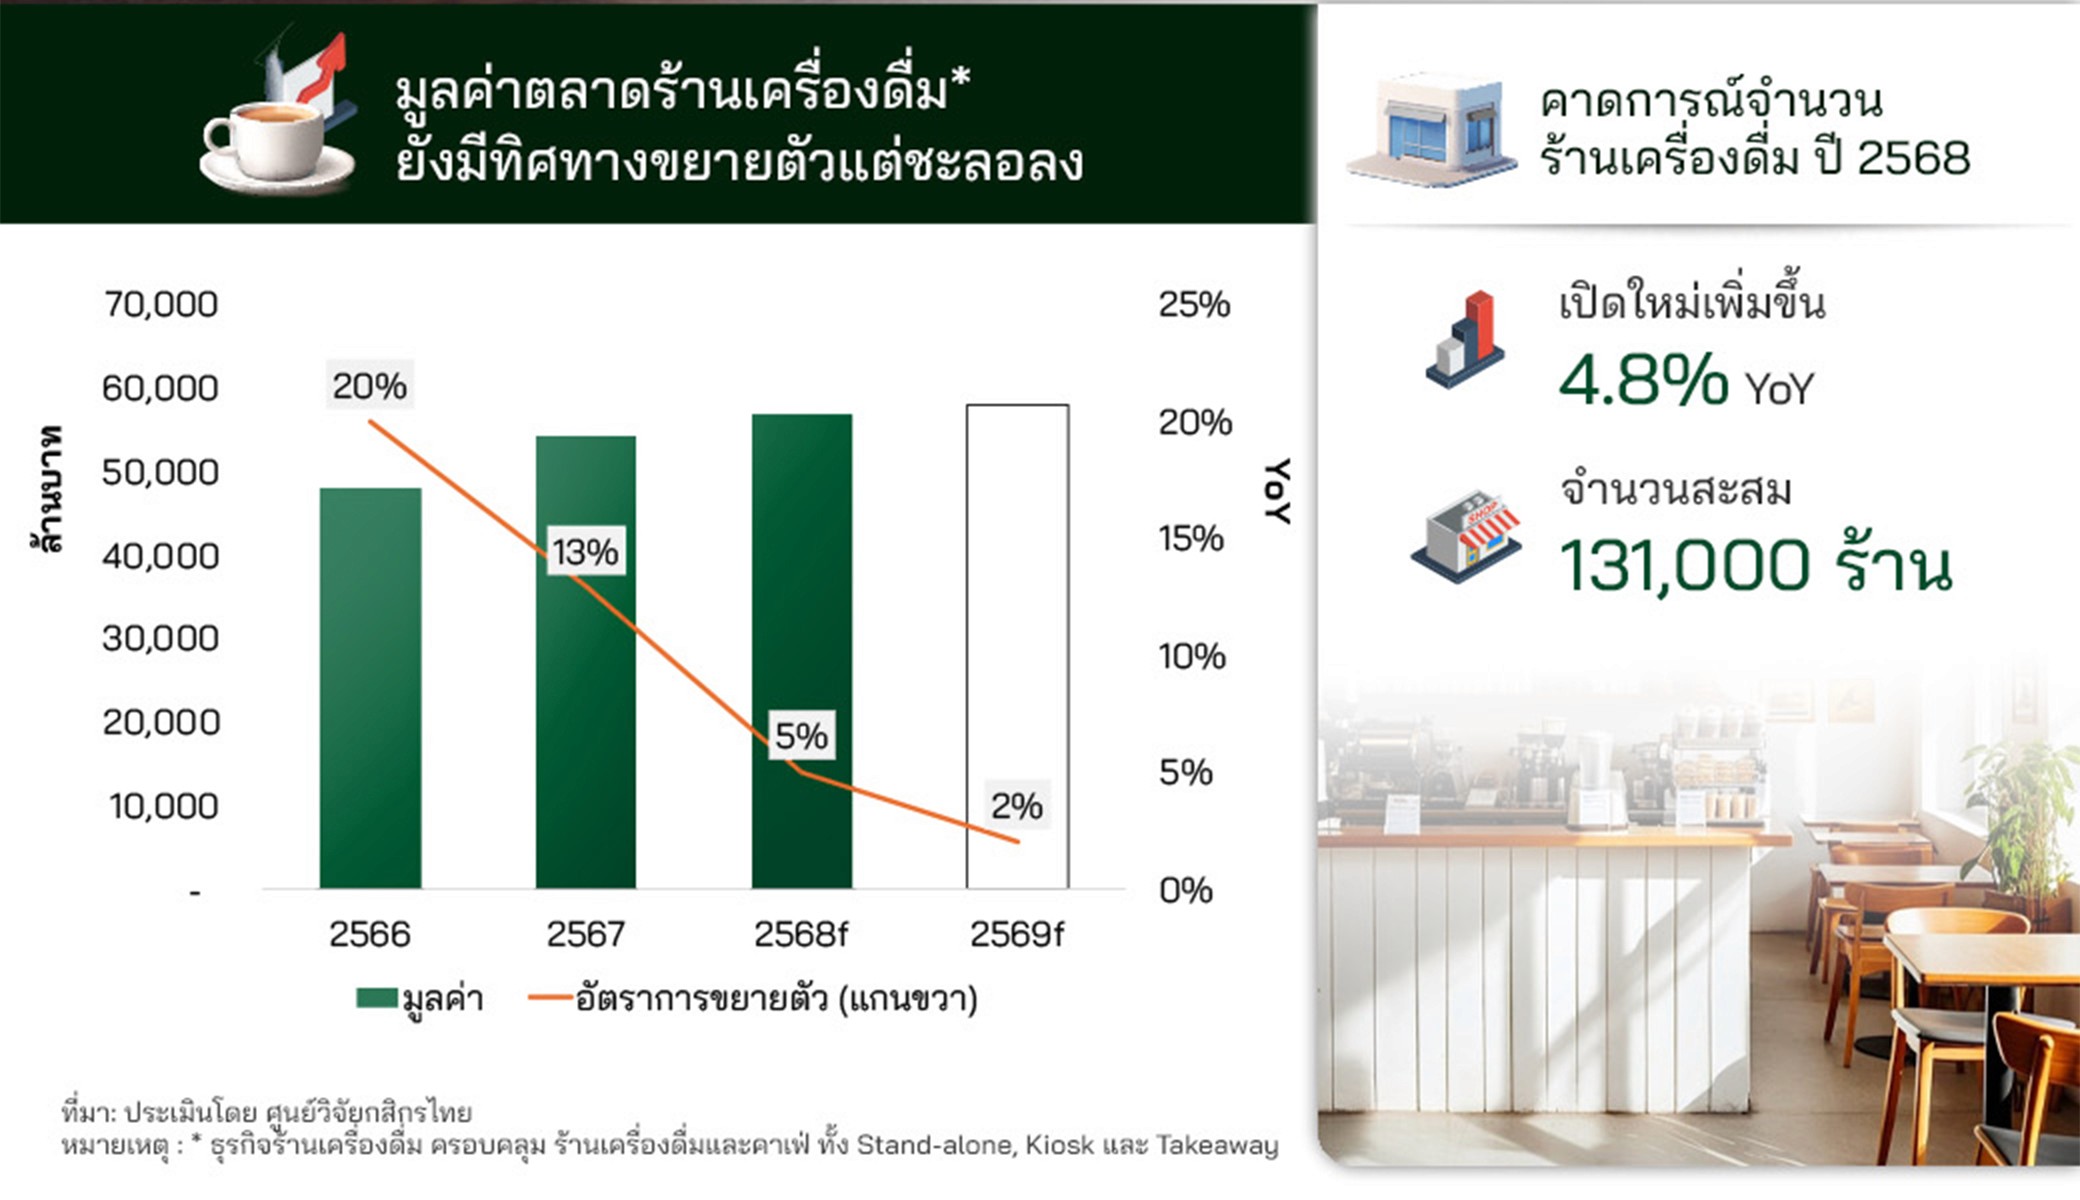
Overall performance has declined for the second consecutive year. This is expected to be caused by external factors such as the continuous slowdown in the beverage market expansion. Growth dropped from 20% in 2023 to just 5% in 2025, even though the market is still growing.
Reference: Kasikorn Research Center
HOW WE CRACK?!
Simple analysis example: From a basic question: What kind of videos do people like the most?
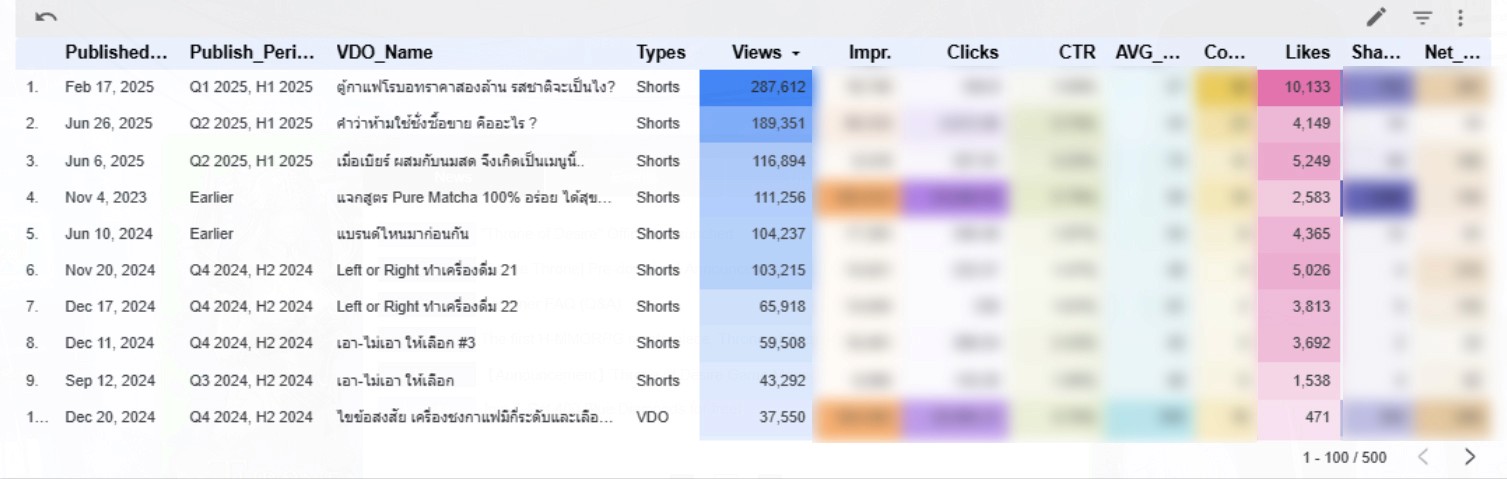
I exported YouTube backend data to create a dashboard, making it easier to view multiple datasets simultaneously since YouTube only provides basic line graphs. I used various metrics to measure and compare. The first example involves sorting from low-to-high and high-to-low to see which clips performed best or worst across more than 500+ videos.
However, comparing the overall picture alone is not enough. We must filter by category: short-form, long-form, and live streams. We also need to separate views and posting dates by quarters in 2024 and 2025 as detailed as possible to compare specific performance targets. Through this detailed analysis, we saw that the performance of horizontal long-form videos improved clearly. Compared to the quantity, views increased by 46% as mentioned above.
For high-view clips, the short-form ones are usually variety-style content featuring unusual activities or educational clips that answer common questions people rarely talk about. For long-form, the popular ones are product experiments and comparisons. This is likely because people want to know the results without spending money or testing things themselves, especially since many items are quite expensive. The team designed the tests in these clips to match each product so viewers can see the differences and use the info for basic decision-making.
Several previously viral clips remained popular in 2025, especially shorts featuring unique or unconventional ideas. As for older long-form videos that still perform well, they are mostly basic knowledge or drink recipes. This suggests that people are still interested in entering this business even though the growth rate has slowed down.
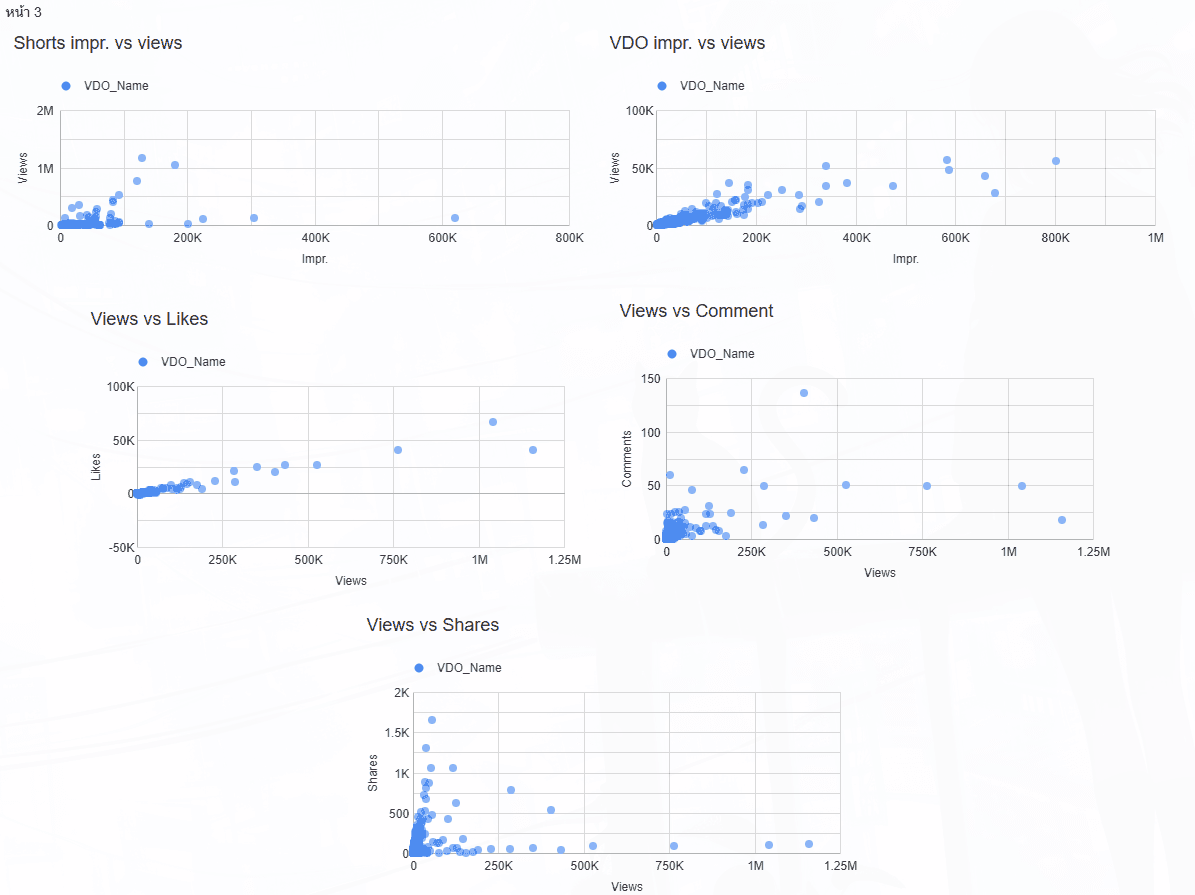
Using scatter plots to find various relationships (as seen in the image):
(Shorts) Impr. vs Views (r = 0.36, low impact): High impressions do not guarantee high views, which is understandable as shorts rely on people scrolling past them.
(Long-form) Impr. vs Views (r = 0.89, high impact): The higher the impressions, the higher the views. Therefore, we must try to get the algorithm to push impressions as much as possible.
(Shorts + Long-form) Views vs Likes (r = 0.96, very high impact): More views lead to more likes, which is quite normal.
(Shorts + Long-form) Views vs Comments (r = 0.57, moderate impact): Views do not guarantee many comments. The average number of comments for a typical channel is usually under 20. If we want more comments and engagement, the content must actively prompt people to express themselves.
(Shorts + Long-form) Views vs Shares (r = 0.1, almost no impact): Views do not guarantee shares. It depends more on the content. Clips with high shares are usually recipes or educational tips.
This means that even with high views, engagement is not guaranteed. If the goal is to build a community, we should focus more on attracting people to engage. We gained a lot of passive engagement from old recipe and knowledge videos. We could potentially remake some of these or create something now for future benefits.
Finding ideas from external sources
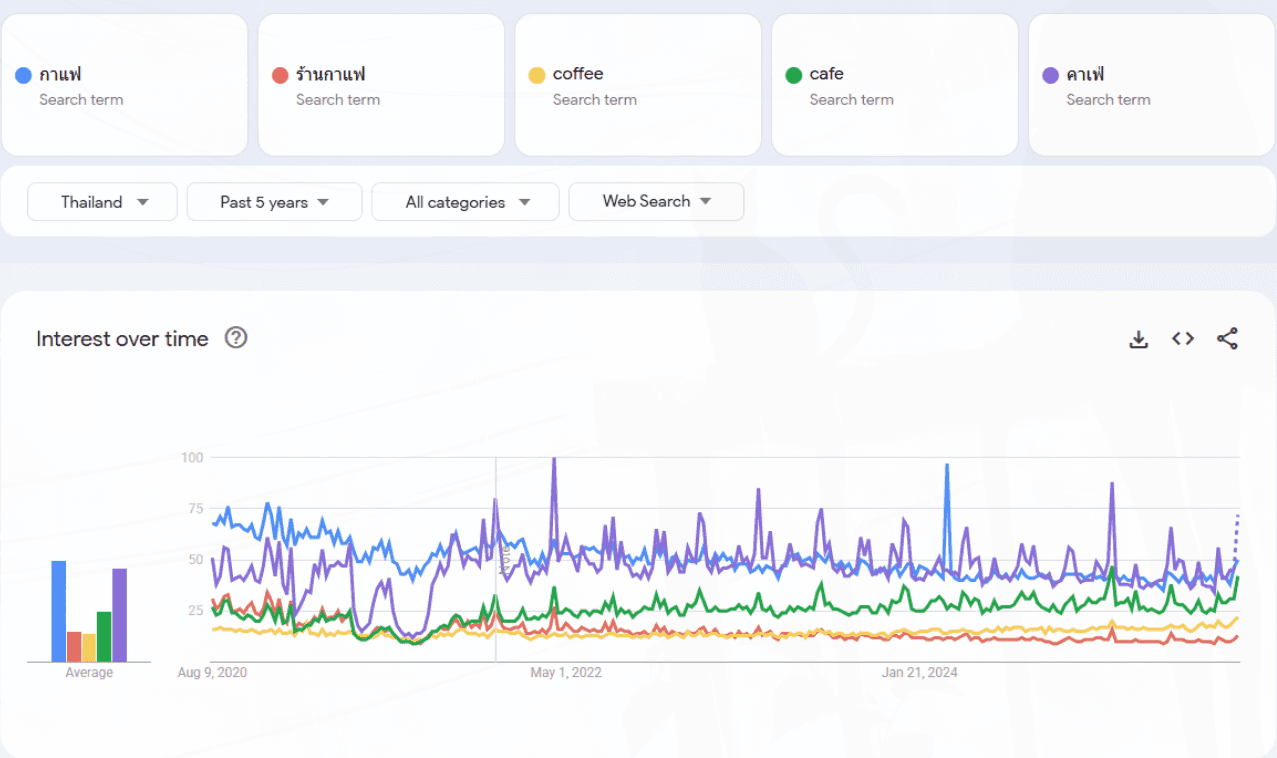
We can find plenty of external data to use as starting points for content. One tool that helps is keyword analysis to identify search intent and trends, some of which we can prepare for in advance. In this case, we use Google Trends to analyze topics related to coffee and drinks.
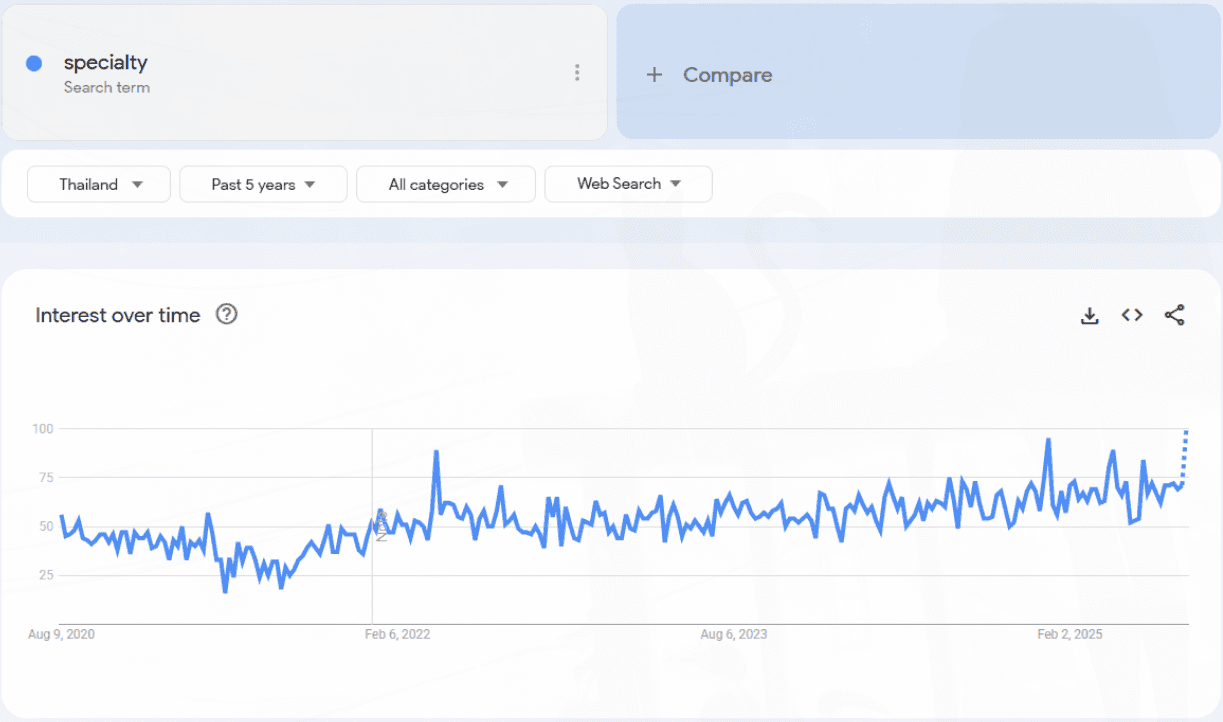
The analysis shows that the trend line for coffee in Thailand shows people searching for the terms coffee or coffee shop less frequently, excluding the peak period during 2023-2024. The word cafe remains steady, likely because people continue to search for cafes to hang out or take photos. However, the English terms cafe and coffee are actually increasing. This might be because people are using more English or using them with other terms like cafe near me or cafe followed by a shop name. There is also a rise in searches for specialty coffee or shop name + coffee. Contrary to the general word for coffee, the term specialty is being searched more and more.
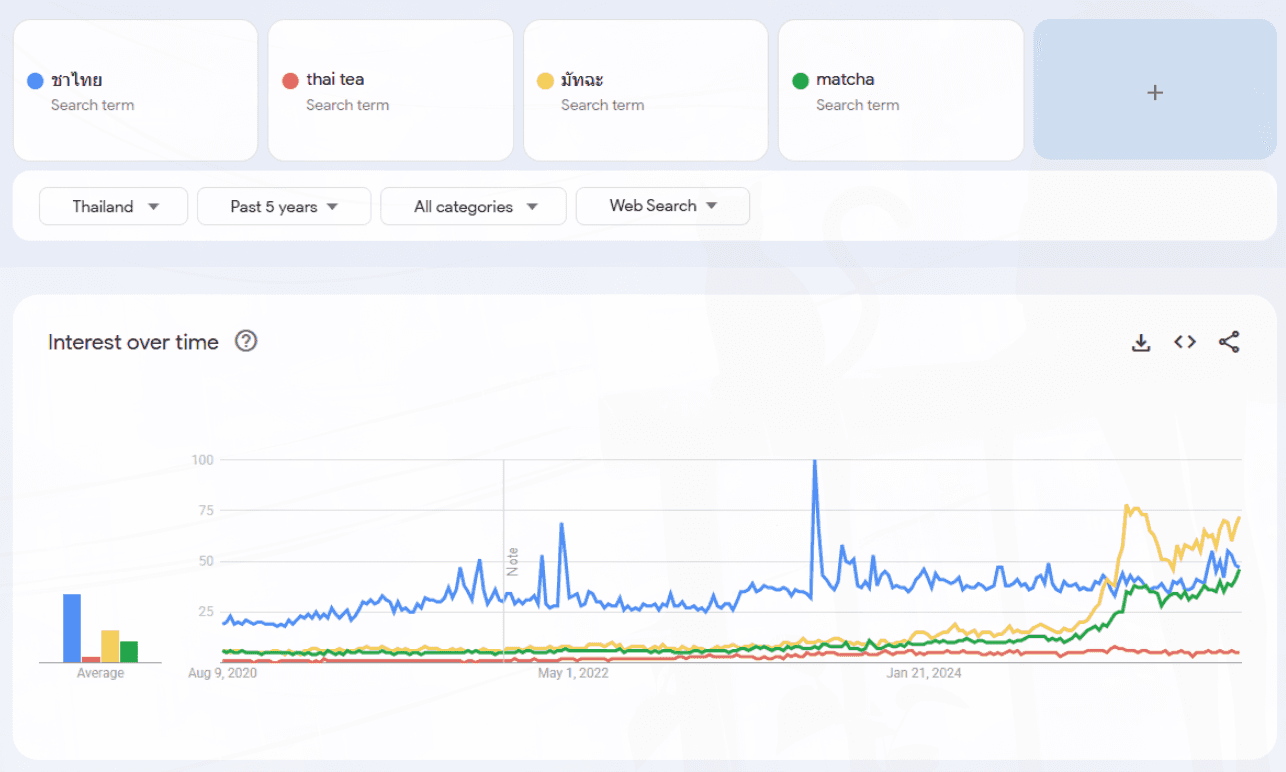
Additionally, Thai tea is seeing a steady increase in searches along with matcha. The graph spiked significantly at the end of last year and is likely to stay high for a while.
When combined with the business domain, this remains consistent. We have moved into the era of specialty coffee, which is becoming increasingly popular because it is more accessible. For example, Uno Coffee sells commercial-grade Geisha coffee at low prices. While the quality might not reach the 80 to 90+ point score of premium beans, it makes specialty coffee reachable for everyone. This specialty trend is also moving toward the Thai tea we usually drink. Instead of standard black or red tea blends, people are starting to grade the tea more carefully to create different flavors and experiences. Because of this, we plan to create more content presenting the specialty aspect, especially regarding equipment that helps maintain consistent flavors for every cup, preparing for a future where specialty is accessible to everyone.

